
There is a particular kind of frustration that comes from standing at the edge of a lake at 5am, the sky doing something extraordinary, and blowing the shot because you trusted your eyes instead of your data. I’ve done it more times than I care to admit. The sky looked balanced through the viewfinder, the image felt right, and then I got home and found a washed-out sun with no detail to recover. Twenty years into doing this professionally, I still have to remind myself: the scene lies. The histogram doesn’t.
That’s exactly the problem that William Patino tackles head-on in this tutorial. Watch the full tutorial on YouTube – it’s aimed squarely at landscape photographers who keep getting inconsistent results at sunrise and sunset, and it cuts through a lot of the vague advice that floats around about exposure. What Patino gives you is a concrete, repeatable process for reading the histogram in real time and adjusting before you press the shutter. No guessing, no chimping after the fact, no hoping the RAW file will save you.
I’ve been teaching exposure in my own workshops for years, and I found myself nodding through most of this one. Here’s how to put it into practice, step by step.
Step 1: Understand What the Histogram Is Actually Showing You
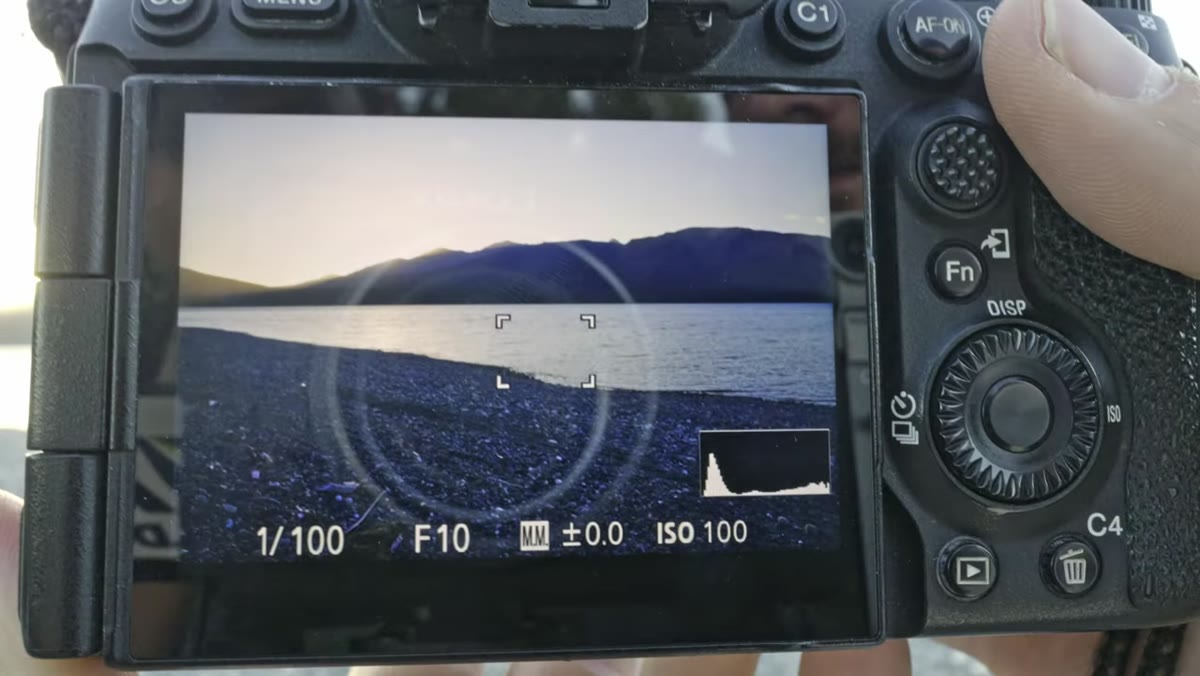 Histogram graph labeled with shadows, midtones, and highlights
The histogram is a graph of tonal data. The left edge represents your darkest shadows and pure blacks. The right edge represents your brightest whites and blown highlights. Everything in the middle is your midtone range. The height of the peaks at any given point tells you how many pixels in the image fall at that brightness level – not good or bad by itself, just information.
Histogram graph labeled with shadows, midtones, and highlights
The histogram is a graph of tonal data. The left edge represents your darkest shadows and pure blacks. The right edge represents your brightest whites and blown highlights. Everything in the middle is your midtone range. The height of the peaks at any given point tells you how many pixels in the image fall at that brightness level – not good or bad by itself, just information.
Think of it as a map of where your light is living. A scene with a lot of dark rock and shadowed foreground will show a hump on the left. A bright overcast sky will push data toward the right. Neither shape is wrong on its own. The shape that gets you in trouble is one where data is spilling off either edge, which tells you information is being permanently lost.
Step 2: Enable the Histogram on Your Camera Display
 Camera live view screen with histogram visible in corner
On most cameras, cycling through the display or info button will bring up the histogram overlay on your live view screen. On mirrorless bodies – which is what Patino demonstrates – you can pull the histogram up in both the rear screen and the electronic viewfinder simultaneously. That second option is worth setting up if you haven’t. When you’re shooting into a bright sunrise with the camera raised to your eye, the last thing you want to do is drop the camera to check a separate screen.
Camera live view screen with histogram visible in corner
On most cameras, cycling through the display or info button will bring up the histogram overlay on your live view screen. On mirrorless bodies – which is what Patino demonstrates – you can pull the histogram up in both the rear screen and the electronic viewfinder simultaneously. That second option is worth setting up if you haven’t. When you’re shooting into a bright sunrise with the camera raised to your eye, the last thing you want to do is drop the camera to check a separate screen.
Get this configured before you leave home. I keep a small note in my kit bag listing the menu path for any new camera I’m testing. Five minutes at the kitchen table saves you ten minutes of squinting at menus in the dark.
Step 3: Watch How the Histogram Moves As You Change Settings
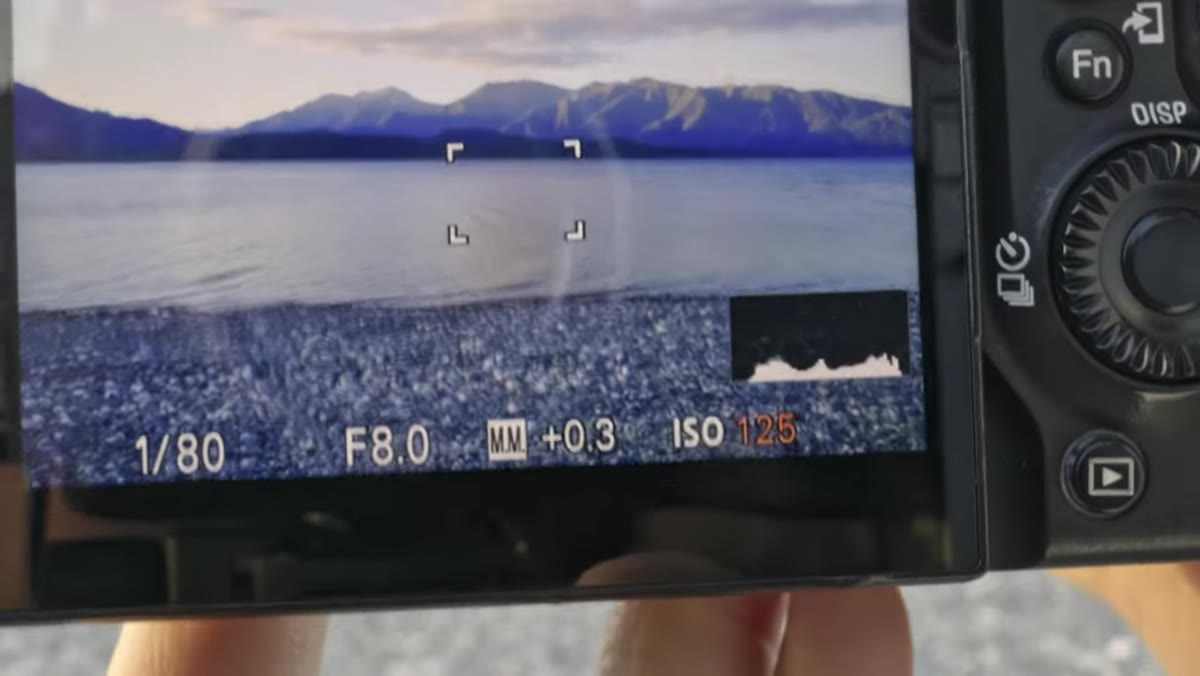 Histogram shifting left and right as shutter speed changes
Here is where it becomes genuinely useful. As you adjust ISO, aperture, or shutter speed, watch the histogram graph slide left or right in real time. Increase your exposure and the data moves right, toward brighter tones. Pull it back and everything shifts left. You are watching the exposure happen before the image is captured.
Histogram shifting left and right as shutter speed changes
Here is where it becomes genuinely useful. As you adjust ISO, aperture, or shutter speed, watch the histogram graph slide left or right in real time. Increase your exposure and the data moves right, toward brighter tones. Pull it back and everything shifts left. You are watching the exposure happen before the image is captured.
This real-time feedback loop is the whole game. You are no longer reacting to a bad image after the fact. You are dialing in the exposure while the light is still doing what it’s doing.
Step 4: Keep the Data Inside the Graph
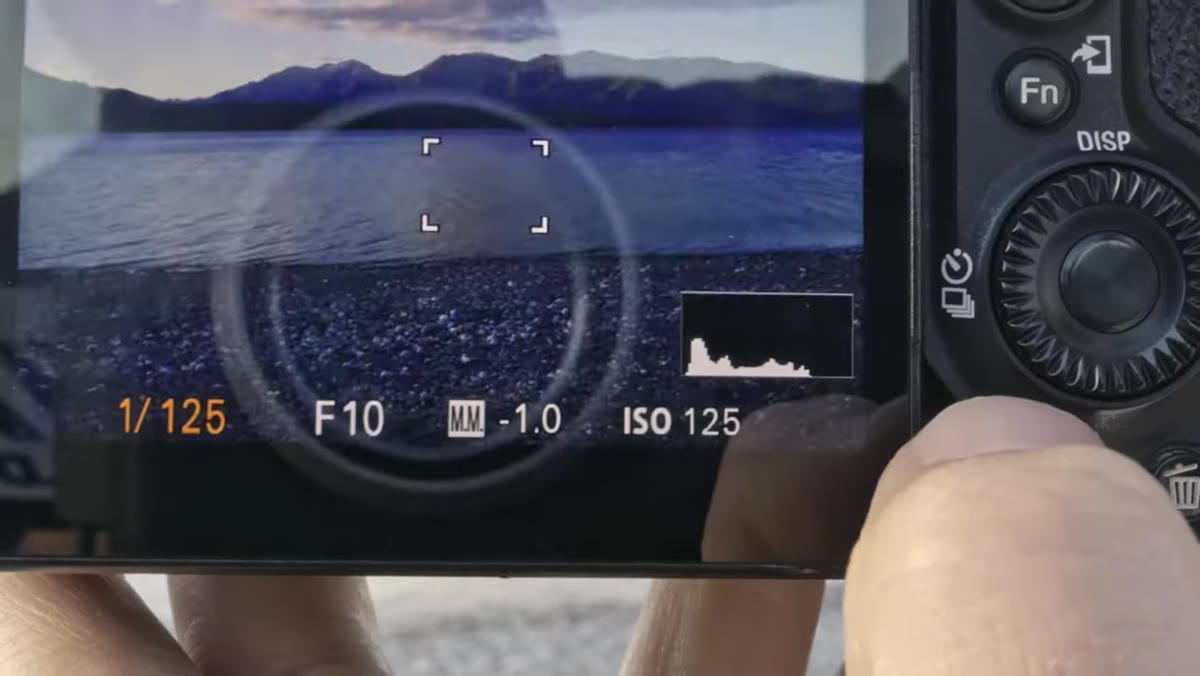 Histogram with data clipping off the right edge, overexposed
Patino’s core rule is straightforward: keep the histogram data from running off either edge of the graph, with particular attention to the right side. Data spilling off the right edge means highlights are clipped – detail in those bright areas is gone, and no amount of post-processing brings it back. Data falling off the left edge means crushed blacks, which is less catastrophic because modern sensors, especially mirrorless bodies, have significant shadow recovery latitude.
Histogram with data clipping off the right edge, overexposed
Patino’s core rule is straightforward: keep the histogram data from running off either edge of the graph, with particular attention to the right side. Data spilling off the right edge means highlights are clipped – detail in those bright areas is gone, and no amount of post-processing brings it back. Data falling off the left edge means crushed blacks, which is less catastrophic because modern sensors, especially mirrorless bodies, have significant shadow recovery latitude.
The height of the peaks doesn’t need to worry you. A tall spike just means a lot of pixels share that brightness level – totally normal. What matters is whether the graph is contained within its borders.
Step 5: Expose to Protect the Highlights, Especially in Backlit Scenes
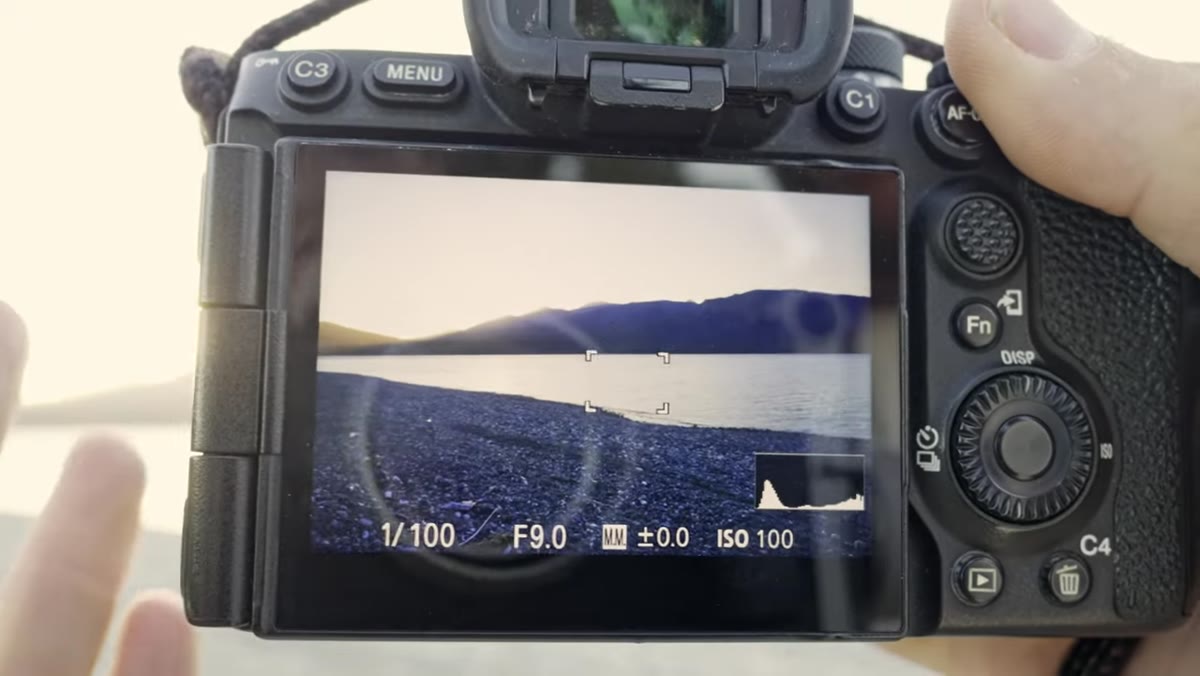 Backlit sunset scene with histogram just kissing right edge
This is the scenario that trips up most photographers: shooting directly into a sunrise or sunset with a bright sky dominating the frame. Your foreground goes dark, the sky is intense, and the histogram is pressing hard against that right wall. Patino’s approach here is to intentionally underexpose until the highlights are no longer clipping – even if the resulting image looks very dark on the screen.
Backlit sunset scene with histogram just kissing right edge
This is the scenario that trips up most photographers: shooting directly into a sunrise or sunset with a bright sky dominating the frame. Your foreground goes dark, the sky is intense, and the histogram is pressing hard against that right wall. Patino’s approach here is to intentionally underexpose until the highlights are no longer clipping – even if the resulting image looks very dark on the screen.
Speed up your shutter, stop down your aperture, or lower your ISO until that right edge clears. The image will look underexposed when you review it. That’s correct. The shadow information in your foreground can be lifted in post-processing. The blown-out sky cannot be fixed. You are making a deliberate trade, and it’s the right one.
Step 6: Lift the Shadows in Post, Not in Camera
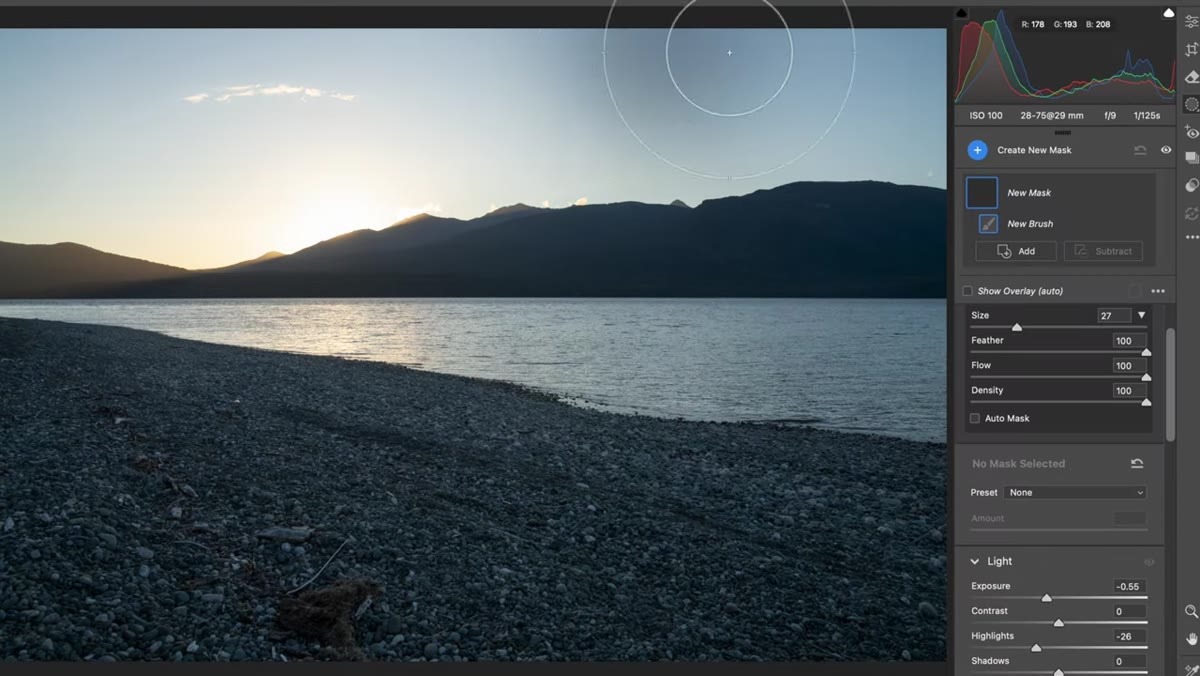 Raising exposure in post while histogram shows shadow-heavy capture
This is what Patino calls “exposing to the right” – getting as much tonal data into the frame as possible while keeping the highlights from clipping. The image you capture may look dark, but it is full of recoverable information. In Lightroom or your raw processor of choice, bring the exposure up, recover your shadows, and the foreground detail will come back cleanly.
Raising exposure in post while histogram shows shadow-heavy capture
This is what Patino calls “exposing to the right” – getting as much tonal data into the frame as possible while keeping the highlights from clipping. The image you capture may look dark, but it is full of recoverable information. In Lightroom or your raw processor of choice, bring the exposure up, recover your shadows, and the foreground detail will come back cleanly.
Trying to compensate in camera by brightening the exposure when you’re facing a bright sky only destroys the sky. The sequence matters: protect highlights at capture, recover shadows in processing.
One Thing I’d Add From My Own Experience
Patino covers the mechanics of this perfectly, and I’d only add one field note from years of shooting in high-contrast light here in Central Oregon. When you’re working at the very edges of the dynamic range – thin clouds near the sun, bright snow in the foreground, direct backlighting – check your histogram after every single shot, not just the first frame of a sequence. The light at sunrise moves fast. What was a safe exposure thirty seconds ago may be clipping now as the sun rises above the horizon. Build the habit of glancing at that graph after every capture, not just when you suspect something went wrong.
Still shoots film occasionally because it forces him to slow down and think before pressing the shutter – that discipline maps directly to this. Every frame costs something. The histogram is your way of making each one count.
The single most important thing to take away from this technique: a dark image with clean highlights is always fixable. A bright image with blown highlights is not. That asymmetry should govern every exposure decision you make in the field.
Watch the full tutorial on YouTube – Patino demonstrates this live in the field with real camera settings changing in real time, and seeing the histogram move on an actual sunset scene makes the whole system click into place faster than any written description can manage.
Comments
Leave a Comment